Trading signals free: how we tracked and verified performance

The market for trading signals free of charge is not uniformly fraudulent. It is, however, built around incentives that deserve scrutiny. A broker can use free copy trading signals to acquire funded accounts; an Introducing Broker can earn a commission every time a referred client trades; a creator can build an audience for a paid channel, managed account arrangement, or proprietary product. None of those models automatically invalidates a signal. They do mean that headline returns, screenshots, and leaderboard placement should be treated as promotional claims until independently verified.
Our review standard was deliberately unsentimental: could the performance be traced to a live or verifiably connected account, did its risk-adjusted numbers survive inspection, and could an ordinary follower reasonably reproduce the result after slippage, spread, and latency? Most “best free trading signals” lists do not get that far. They stop at returns. Returns are where the sales copy begins; the risk record is where it usually becomes less comfortable.
The anatomy of a free signal: distribution is often the product
A free signal is rarely free in the economic sense. The user may not pay a subscription fee, but the provider, broker, affiliate, or platform usually expects compensation elsewhere. This is not a moral accusation. It is basic counterparty analysis.
The most common structure is an Introducing Broker arrangement. A provider distributes entries and exits through Telegram, Discord, a social trading network, or a broker-hosted community. Followers open accounts through a designated affiliate link. The provider then receives compensation linked to client activity, commonly per trade or per lot. Under that model, trade frequency is not a neutral strategic choice. It can become part of the creator’s revenue engine.
That creates a conflict which retail users routinely miss: the provider’s ideal outcome may be a highly active follower base, while the follower’s ideal outcome may be fewer, more selective trades with lower aggregate transaction costs. Those goals can align. They can also diverge sharply.
Free social trading signals generally fall into four commercial categories:
1. Broker acquisition signals. The provider publishes ideas or a copy portfolio in exchange for referred accounts. The broker gains deposits and trading volume; the provider may receive affiliate compensation; the follower receives access without a subscription charge.
2. Lead-generation signals for a paid service. Free calls are designed to establish a public track record, cultivate a community, and direct users toward premium alerts, education, or managed-risk products. The free channel may show only winning trades, omit stopped positions, or report results before realistic execution costs.
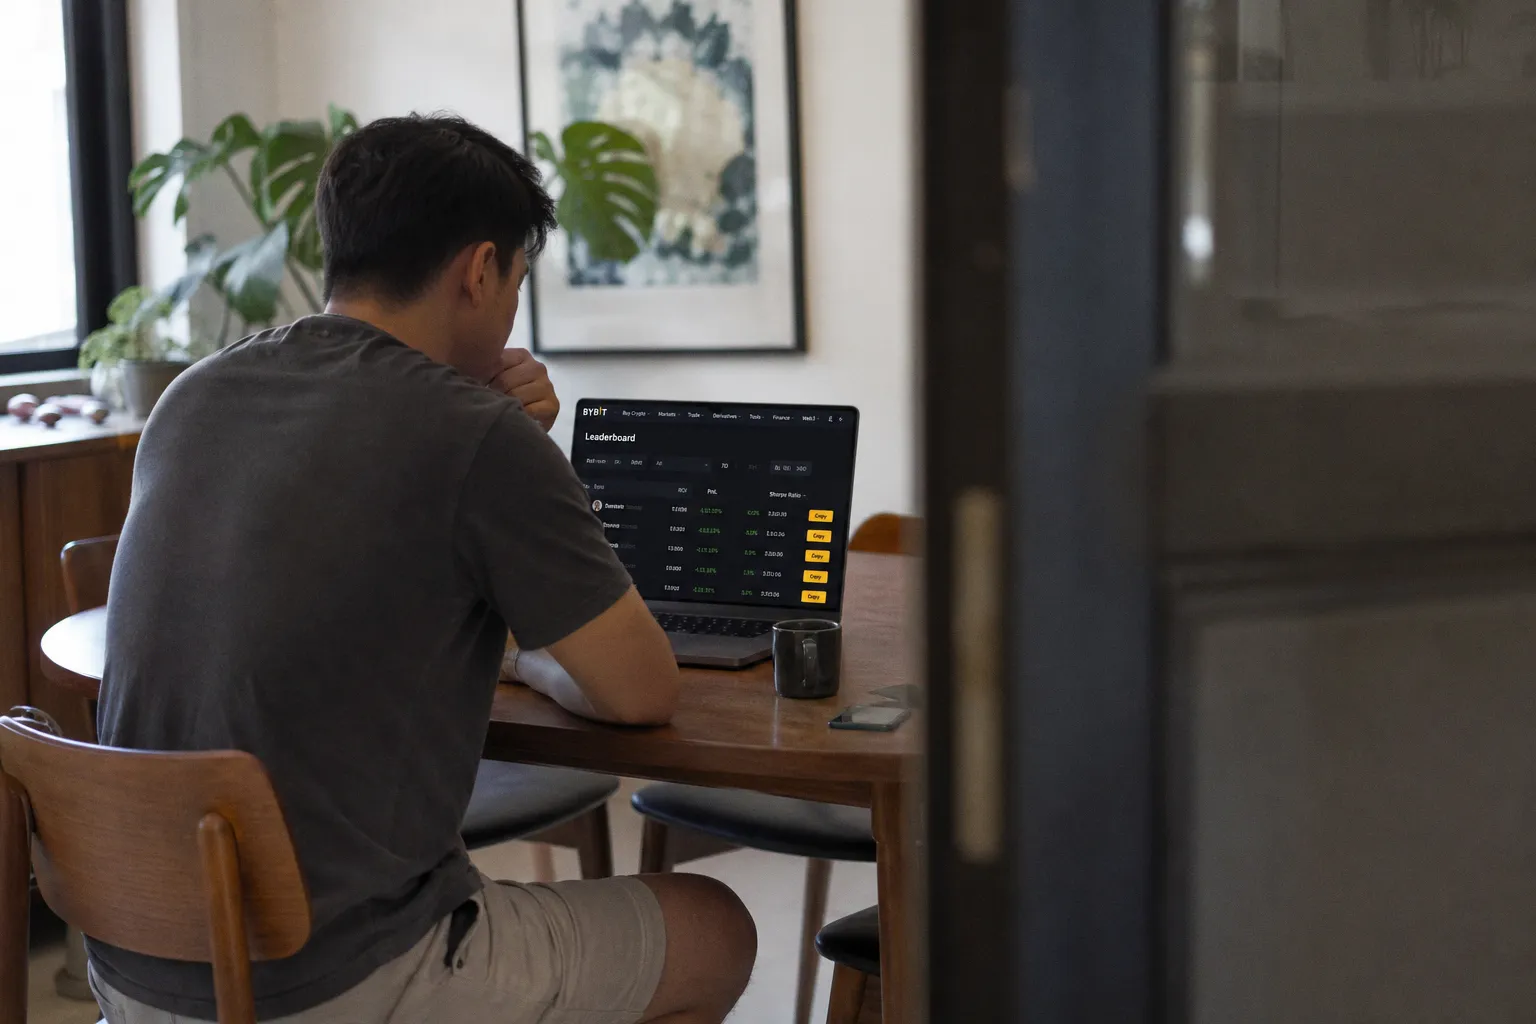
3. Platform-native creator programs. Social trading platforms may reward popular investors through fixed payments, assets under copy, or tiered incentives. Here, follower retention and risk limits can matter more than sheer turnover—but the platform’s own ranking and eligibility rules still shape creator behaviour.
4. Unstructured social-media signals. These are the least accountable: screenshots, edited trade histories, post-trade calls, and deleted losing messages. There may be no regulated intermediary, no durable audit trail, and no meaningful recourse if the account behind the claims never existed.
The problem is not that creators are paid. The problem is opacity. A provider who earns from transaction volume has a duty, at minimum, to disclose that relationship plainly. A follower who does not know whether a signal is monetised through spreads, commissions, affiliate rebates, copied assets, or a paid upsell is not evaluating performance in a clean commercial environment.
“Free” describes the subscription price. It says nothing about the incentive structure, execution cost, or evidentiary quality of the signal.
Third-party verification is the first gate, not a premium feature
A screenshot is not verification. A spreadsheet is not verification. A Telegram channel showing a long sequence of take-profit messages is certainly not verification, especially when losing calls can be edited, buried, or simply deleted.
For free copy trading signals, the minimum credible evidentiary standard is a trading record synchronised from the broker side through an independent monitoring service such as Myfxbook or FXBlue. These services can use a read-only investor password to connect to the broker server. The relevant point is not the brand name; it is the architecture. The account history is imported from the execution venue rather than manually typed in by the provider.
That does not make the strategy safe. It does make certain forms of cosmetic manipulation substantially harder. A provider cannot simply replace an inconvenient closed loss with a winning ticket in a public dashboard if the data is being read from the underlying account feed.
When testing free signals, we would not treat an account as adequately evidenced unless the following points were visible or could be established from the verification page:
- The account is live, not a demo account. Demo results can be useful for system development, but they do not establish that a strategy survives real spreads, liquidity conditions, requotes, margin pressure, or the provider’s own psychological discipline. A demo record presented as equivalent to live performance is a material warning sign.
- The track record is long enough to include adverse conditions. A few profitable weeks reveal very little. Short histories routinely flatter high-leverage and mean-reversion strategies because the loss event that defines their actual risk profile has not occurred yet.
- Closed and open exposure can be distinguished. Some providers display only closed results while carrying large unrealised losses. A seemingly smooth equity curve may conceal positions that have not been closed because closing them would crystallise unacceptable drawdown.
- Deposit and withdrawal activity is visible. Raw percentage return can be misleading when capital is repeatedly added after losses or withdrawn after gains. The relevant inquiry is how the account performed relative to the capital genuinely exposed.
- Trade history and risk statistics remain accessible. A public headline return without order-level history prevents meaningful analysis of holding time, average loss, concentration, and martingale-like recovery behaviour.
- The broker relationship is identifiable. This is not mere formality. Broker jurisdiction, execution model, and client fund segregation policy affect the credibility of the record and the follower’s counterparty risk. A strategy may be mathematically coherent while the intermediary holding client funds is the weak link.
There is a further distinction worth making. Independent verification confirms that trades occurred in a connected account. It does not establish that the provider had a fiduciary duty to followers, that the broker is appropriately authorised in the follower’s jurisdiction, or that copied results will match the master account. Those are separate questions, and promoters often merge them into one reassuring but inaccurate phrase: “fully verified.”
A high win rate is often an alibi, not evidence of edge
The most abused metric in the free-signal market is win rate. A provider with an 85% or 90% winning-trade ratio can still have a structurally fragile strategy if the occasional loss is many times larger than the average win. This is the familiar profile of systems that bank small gains until a single trend, gap, or liquidity failure takes back months of profits.
The more useful starting point is Profit Factor:
Profit Factor = gross profits divided by gross losses.
A figure above 1.0 means gross profits exceeded gross losses over the observed period. For a strategy claiming a sustainable edge, a Profit Factor above 1.5 is a more credible working benchmark than a flashy win rate. It is not a guarantee. It is simply harder to manufacture through selective presentation.
Consider the difference:
| Metric | What it can reveal | How it can mislead |
|---|---|---|
| Win rate | Frequency of profitable trades | Ignores whether losses are vastly larger than gains |
| Profit Factor | Relationship between total gross gains and gross losses | Can still be distorted by a short sample or hidden open losses |
| Maximum drawdown | Depth of the account’s worst peak-to-trough decline | Does not show how close the strategy came to a margin event |
| Average win vs. average loss | Whether payoff structure is balanced or dependent on rare large losses | Requires enough trade history to be meaningful |
| Trade frequency | Exposure to spreads, commissions, and execution friction | Does not by itself prove overtrading or an IB conflict |
Maximum drawdown should be read alongside Profit Factor, not in isolation. A strategy with a respectable Profit Factor but repeated drawdowns approaching or exceeding 25% places a substantial burden on the provider to explain its position-sizing logic. For a retail follower, a 25% decline is not merely an uncomfortable chart feature. It can cause panic exits, break a personal risk mandate, and make recovery mathematically much harder.
The most concerning pattern is not a single losing month. Losses are normal. The pattern to interrogate is a record combining:
- very high win rate;
- modest, repetitive gains;
- a small number of enormous losses or still-open losing baskets;
- escalating trade size after adverse moves;
- unusually low reported drawdown relative to visible floating exposure;
- a short operating history paired with aggressive annualised return claims.
That profile often indicates a recovery mechanism rather than a robust entry model. The account may look disciplined until the first period in which the market refuses to revert.
MQL5’s Reliability metric is useful precisely because it attempts to penalise some of these features, including excessive leverage, high drawdowns, and very short histories. Its calculation was updated as recently as December 2023, reflecting an obvious platform problem: raw returns reward behaviours that may be dangerous for subscribers. But a platform risk score is still a screening device, not an insurance policy. The underlying history remains the evidence.
The relevant question is not “How often does this provider win?” It is “What must go wrong before the account loses an amount the follower cannot rationally tolerate?”
The hidden cost of copying: a verified master can still produce inferior follower returns
Even a legitimate, independently verified master account is not a promise that the follower will receive the same outcome. Copy trading creates a second layer of execution risk between signal generation and retail-client result.
The master may trade through a low-latency infrastructure, a different liquidity pool, lower commission schedule, or account type unavailable to followers. The follower may face a wider spread, slower order routing, minimum-lot rounding, overnight financing, or a different symbol specification. A signal that extracts a narrow intraday edge can be economically viable for the provider and nearly meaningless for the copier.
Slippage and execution latency can create a 5–15% discrepancy between a provider’s reported profit and a follower’s realised net result. That range should not be read as a universal rule; it is a practical reminder that performance is transmitted through imperfect infrastructure. The shorter the holding period and tighter the intended target, the more punishing the discrepancy becomes.
This is why copying a strategy based on five-pip scalps, rapid breakouts, or news-sensitive entries is legally and operationally different from copying a lower-turnover portfolio with wider targets. The first depends heavily on execution quality. The second may depend more on position sizing and holding discipline. Neither is inherently superior; one is simply more vulnerable to replication failure.
Before treating a free signal as genuinely copyable, examine these operational frictions:
1. Signal-to-fill delay. Manual alerts, public channel posts, and overloaded copy infrastructure all introduce delay. If the master’s average holding period is short, delay is not a minor inconvenience; it can invert the trade’s risk-reward profile.
2. Broker and account-type mismatch. A provider’s ECN-style pricing, leverage terms, and available instruments may not match a follower’s retail account. Similar-looking symbols can carry different spreads, swaps, and contract values.
3. Position-size scaling. Platforms may scale trades by equity, fixed lot, proportional allocation, or a user-selected multiplier. Small accounts often suffer from rounding, meaning their actual exposure does not track the master’s exposure cleanly.
4. Open-trade copying. Entering an already profitable or already stressed position changes the follower’s entry price and remaining downside. A provider’s reported result may include gains captured before the follower ever joined.
5. Costs outside the headline return. Commission, spread, financing, conversion charges, and platform fees each consume a portion of gross performance. A high-turnover signal can look impressive before costs and pedestrian after them.
The provider’s published curve should therefore be treated as the master account’s historical record, not as a representation that every subscriber received identical performance. Any platform or creator implying otherwise is making a claim that deserves unusually close reading.
What eToro and MQL5 standards actually tell us
Platform controls are useful because they impose some minimum friction on the race to the top of a leaderboard. They are not evidence that every listed provider has been approved as suitable for every follower.
eToro’s Popular Investor entry requirements illustrate the distinction. A candidate needs at least two months of trading history, minimum equity of $2,000, and a daily risk score of 7 or below to qualify for the entry tier. These requirements do not certify future profitability. They establish a threshold for programme participation and help the platform exclude accounts that are too new, too lightly capitalised, or visibly too risky under its own methodology.
Two months, in particular, is a floor—not a meaningful substitute for a full-market-cycle record. It may be enough to demonstrate that an account exists and has followed basic programme rules. It is not enough to prove that a strategy can withstand prolonged volatility, correlated market moves, or a period in which its central assumption fails.
MQL5 addresses a related problem through its Reliability metric. The system’s use of penalties for high leverage, excessive drawdown, and limited history recognises that subscriber protection cannot rely on return percentage alone. Yet reliability scores should be read as a warning system, not delegated decision-making. The platform does not assume the follower’s jurisdictional exposure, tax position, leverage restrictions, or tolerance for capital loss.
This matters because retail client classification is not decorative legal terminology. A retail client typically receives stronger protections than a professional client, but those protections vary by jurisdiction and by the entity actually onboarding the account. A global social trading platform may market itself under a recognisable brand while the client agreement assigns the user to a different group company, under a different regulator, with different complaint routes and negative-balance protections.
The small print to locate is usually not in the creator profile. It is in the platform’s client agreement, order-execution policy, copy-trading terms, and risk disclosure. Look for provisions that:
- classify copying as execution-only rather than portfolio management;
- state that the platform does not assess suitability of the copied provider;
- permit differences between master and follower fills;
- reserve broad discretion to close, reduce, or reject copied trades;
- allocate losses arising from latency, technical outages, or market disruption to the client;
- identify the specific legal entity and jurisdiction contracting with the user.
These clauses are not necessarily improper. In fact, many are commercially inevitable. But they clarify where responsibility ends. The creator may be public; the platform may host the technology; the broker may execute the order; and the retail client may still bear nearly all market and operational loss.
Our verdict: free signals are usable only after the promotional layer is removed
The sensible approach to trading signals free of charge is neither reflexive dismissal nor casual trust. Some free providers have real, externally synchronised records and operate within structured platform programmes. Others are simply customer-acquisition funnels dressed as independent market insight. The difference is visible if the reviewer refuses to stop at returns.
A signal deserves further attention when it has a live, third-party-verified history; sufficient duration to expose its drawdown behaviour; a Profit Factor that is not dependent on a misleading win rate; transparent treatment of open losses; and an execution setup that a follower can realistically replicate. A platform’s risk controls and eligibility requirements are helpful supporting evidence, but they cannot replace that analysis.
The negative finding is just as valuable. If a provider cannot show broker-synchronised history, will not explain its compensation model, presents only screenshots, or treats a high win rate as dispositive proof, the correct conclusion is not that the signal is “high risk.” It is that the claim has not met a basic evidentiary threshold.
In social trading, the leaderboard is marketing space. The account history, the legal entity, the compensation arrangement, and the gap between master execution and follower execution are the actual terms of the transaction.