Evaluate Master Traders on Bybit Using Sharpe Ratio
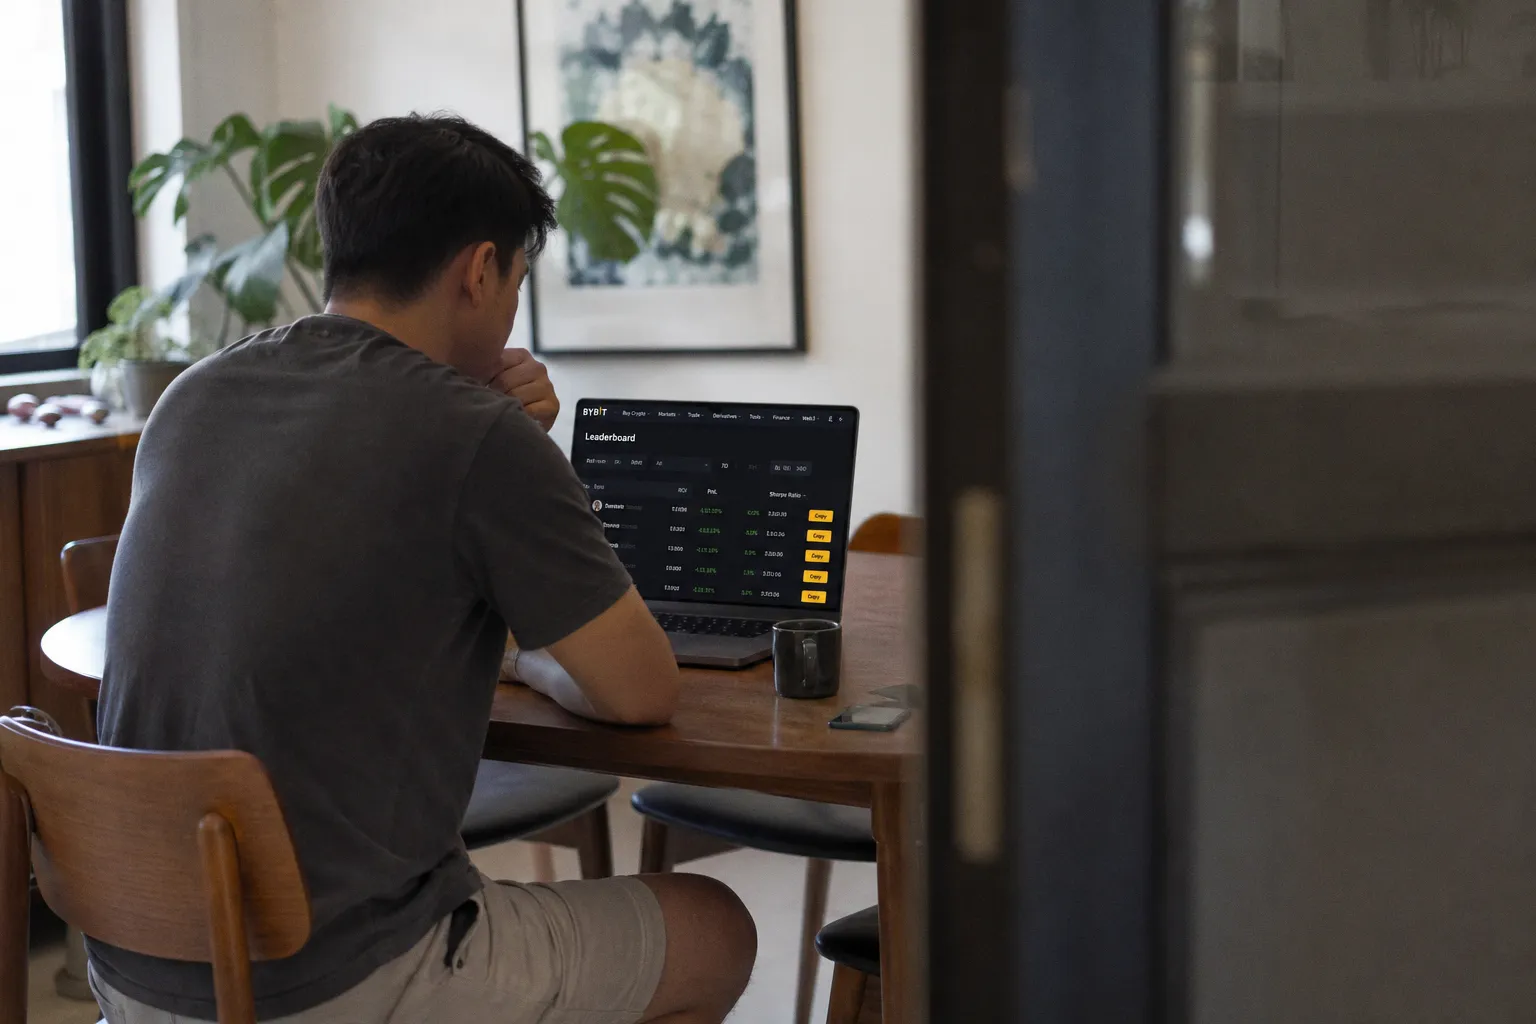
Beyond ROI: Using Sharpe Ratio to Filter Bybit Master Traders
Bybit's Terms of Service, buried in Section 4.3 of their Copy Trading Agreement, state that "past performance of any Master Trader does not guarantee future results" — standard boilerplate you will find on every derivatives platform operating under offshore licensing. Yet the platform's own leaderboard design, which defaults to sorting by ROI, functionally encourages the exact behavior that disclaimer warns against. This is not an oversight. It is a structural incentive baked into the platform's acquisition funnel, and if you are allocating capital to follow a Master Trader without understanding how risk-adjusted metrics expose the difference between disciplined strategy and survivorship bias, you are the product, not the client.
The Sharpe Ratio — a metric Bybit now calculates and displays for each Master Trader — is the single most effective lens for separating genuine consistency from volatile spectacle. But it comes with caveats that neither Bybit's interface nor most community discussions adequately surface.
Why ROI Misleads: The Hidden Danger of High-Volatility Trading
The default leaderboard sort on Bybit's Copy Trading page is ROI over a 30-day window. This is the metric that earns a Master Trader visibility, followers, and — through Bybit's Popular Investor Program — a share of copier trading fees. The incentive structure rewards short-term performance spikes above all else.
Consider what a 300% ROI figure actually tells you. It tells you the outcome of a specific period. It tells you nothing about the path taken to arrive there. A trader who achieves that return through twenty consecutive 2x leveraged positions on low-cap perpetual contracts has taken a fundamentally different risk than one who scalps small edges across BTC and ETH with tight stop-losses. The ROI column treats both identically.
The problem compounds in crypto derivatives markets specifically. Unlike equities, where volatility clusters around earnings cycles and macroeconomic events, crypto perpetual contracts can experience intraday moves of 15-20% on no catalyst whatsoever. A Master Trader riding those swings with high leverage may post spectacular returns for weeks — then lose 80% of follower equity in a single liquidation cascade. The ROI leaderboard will have already promoted that trader to the top during the ascent.
The ROI leaderboard is a marketing surface disguised as a research tool. It sorts by outcome and ignores process — which is precisely backwards for anyone allocating real capital to follow a stranger's trades.
This is where the Sharpe Ratio becomes not just useful but structurally necessary. It is the only readily available metric on the Bybit platform that penalizes volatility in proportion to returns, forcing a question the leaderboard's default view avoids: how much risk did this trader take per unit of profit generated?
Decoding the Sharpe Ratio in the Context of Crypto Markets
The Sharpe Ratio, developed by Nobel laureate William Sharpe in 1966, calculates risk-adjusted return using the formula:
(Rp − Rf) / σp
Where Rp represents the portfolio's return, Rf is the risk-free rate, and σp is the standard deviation of the portfolio's excess return. A higher ratio indicates that returns were achieved with proportionally less volatility — the hallmark of disciplined, repeatable strategy rather than concentrated gambles.
Bybit calculates this ratio for each Master Trader and displays it on their profile page, though the platform does not publicly document the exact risk-free rate (Rf) it applies to crypto assets. This is a significant transparency gap. In traditional finance, the risk-free rate typically references government bond yields — the U.S. 10-year Treasury being the most common benchmark. In crypto, there is no consensus risk-free rate. Stablecoin lending rates fluctuate; DeFi yield benchmarks are themselves volatile. Bybit's chosen Rf value directly impacts the ratio's output, and without disclosure, copiers are interpreting a number against an unstated baseline.
That said, the directional signal remains valuable. Even with an imperfect baseline, the Sharpe Ratio correctly ranks traders on a spectrum from "returns driven by volatility" to "returns driven by strategy." Here are the conventional benchmarks that financial analysts apply:
| Sharpe Ratio Range | Risk-Adjusted Quality | What It Indicates |
|---|---|---|
| Below 0 | Negative | Returns underperformed even the risk-free baseline — capital was destroyed on a risk-adjusted basis |
| 0 to 1.0 | Marginal | Returns exist but do not adequately compensate for the volatility endured |
| 1.0 to 2.0 | Good | Meaningful risk-adjusted edge; returns justify the variance |
| 2.0 to 3.0 | Very good | Strong consistency; suggests defined strategy with controlled downside |
| Above 3.0 | Excellent — and rare | Exceptionally disciplined or structurally advantaged; warrants skepticism about sustainability |
In crypto markets, these benchmarks should be applied with a discount. The underlying asset class exhibits volatility multiples higher than equities or bonds, meaning that what registers as a 2.0 Sharpe in traditional contexts may correspond to far more extreme swings in absolute terms. A crypto Master Trader with a 1.5 Sharpe may be taking more directional risk than a stock portfolio manager with the same ratio. The number measures consistency relative to the trader's own volatility — not absolute safety.
Navigating the Bybit Leaderboard: Applying Risk-Adjusted Filters
Bybit's leaderboard allows filtering by timeframe: 7-day, 30-day, and 90-day views. Each window captures a different dimension of performance, and the Sharpe Ratio's diagnostic value shifts across them.
The 7-day window is effectively noise. Any Sharpe Ratio calculated over seven days of crypto trading is statistically meaningless — the sample size is too small, and a single outsized winning day can inflate the ratio to misleading levels. Treat 7-day metrics as directional signals at best.
The 30-day window is where most copiers make decisions and where Bybit's interface steers attention. A consistently elevated Sharpe Ratio over 30 days suggests the trader has navigated at least one or two significant volatility events without catastrophic drawdowns. This is a meaningful filter. However, 30 days in crypto can span entirely different market regimes — a trending bull phase followed by a choppy consolidation will reward very different strategies. The Sharpe Ratio here measures regime-specific performance, not universal edge.
The 90-day window is the most analytically valuable timeframe available on the platform. Three months captures multiple market phases, liquidation cascades, funding rate extremes, and at least one significant drawdown event. A Master Trader maintaining a Sharpe Ratio above 1.0 over 90 days of crypto derivatives trading has demonstrated something approximating repeatable strategy.
The practical filtering process works as follows:
1. Open Bybit's Copy Trading leaderboard and switch to the 90-day view
2. Sort by ROI to identify the highest-performing traders in the window
3. Click into each trader's profile and locate the Sharpe Ratio displayed alongside ROI, PnL, and maximum drawdown (MDD)
4. Dismiss any trader with a Sharpe Ratio below 1.0 — their returns do not justify their volatility profile
5. Among those above 1.0, cross-reference the Sharpe Ratio against Maximum Drawdown: a high Sharpe with MDD above 50% signals that the ratio may be inflated by an outlier winning streak masking deep risk
6. Cross-reference against Win Rate to confirm the ratio is not the product of a few massive winners propping up many small losses
This is not a checklist that guarantees selection of a profitable trader. It is a triage framework that eliminates the most obviously risk-uncompensated profiles from consideration.
Interpreting Performance Benchmarks: From Good to Excellent — and When Skepticism Applies
A Master Trader displaying a Sharpe Ratio of 2.5 over 90 days on Bybit's leaderboard warrants serious attention. But it also warrants scrutiny of several contextual factors the ratio itself does not capture.
Leverage profile. The Sharpe Ratio does not directly incorporate leverage. A trader running 10x leverage on BTC perpetuals with a 1.8 Sharpe has an inherently more fragile position than a trader running 3x leverage with the same ratio. Bybit displays average leverage on some trader profiles, but it is not consistently surfaced alongside the Sharpe Ratio. Where leverage data is available, treat it as a load-bearing modifier on the ratio's implied stability.
Asset concentration. A Master Trader whose Sharpe Ratio is derived entirely from positions in a single altcoin contract faces idiosyncratic risk that the ratio's standard deviation calculation does not differentiate from diversified risk. If 90% of their PnL comes from one instrument, a single delisting, liquidity event, or exchange-specific anomaly can erase months of risk-adjusted outperformance. Check the trader's position history for concentration patterns.
Market regime dependency. A Sharpe Ratio calculated during a sustained trending market will systematically overstate the quality of directional traders who happened to be on the right side of the trend. The true test of risk-adjusted quality comes during range-bound or declining periods — when generating positive returns requires edge, not just momentum alignment. If a trader's 30-day Sharpe is 3.0 but their 90-day Sharpe is 1.2, the recent performance is likely regime-dependent rather than strategically durable.
A Sharpe Ratio above 3.0 on a crypto derivatives platform should trigger the same reflex as a "guaranteed returns" claim: the higher the number, the harder you need to interrogate the conditions that produced it.
Fee and funding rate impact. Bybit's displayed PnL and ROI figures typically reflect realized and unrealized gains on the trader's positions, but the treatment of funding payments — which in crypto perpetuals can represent a significant drag or tailwind depending on positioning — varies by platform and is not always transparently embedded in the Sharpe calculation. Traders who are consistently on the paying side of funding in a trending market may appear to have better risk-adjusted returns than reality warrants once these carrying costs are fully accounted for.
Building a Holistic Evaluation Framework Beyond the Ratio
The Sharpe Ratio is a filter, not a verdict. It tells you whether returns were achieved with disciplined volatility management relative to the trader's own risk footprint. It does not tell you whether the strategy is sustainable, whether the trader has an information edge, or whether the conditions that produced past performance will persist.
A responsible evaluation framework on Bybit's copy trading platform layers the Sharpe Ratio with several complementary metrics, each addressing a specific blind spot:
- Maximum Drawdown (MDD) reveals the worst peak-to-trough decline the trader has experienced. Pair it with Sharpe: a ratio above 2.0 paired with MDD above 40% is a red flag suggesting the ratio may be survivorship artifact.
- Win Rate contextualizes whether returns are driven by many small consistent gains or a few outsized winners. A low win rate with high Sharpe means the trader relies on asymmetric payoffs — viable, but psychologically brutal for copiers who must endure consecutive losses.
- Follower AUM and Copier Count serve as proxy credibility signals with diminishing returns. Very high follower counts may indicate marketing skill more than trading skill; very low counts with exceptional metrics may indicate a newer profile without enough history.
- Trading Frequency and Holding Period determine whether you are following a scalper, a swing trader, or a position trader. This has direct implications for the copy trading mechanics — latency, slippage, and minimum copy trade sizes affect high-frequency strategies far more than multi-day holds.
Bybit's Popular Investor Program creates an additional layer of incentive misalignment that copiers should understand. Master Traders in the program earn a percentage of copier trading fees, meaning their compensation is partially decoupled from their PnL and partially tied to trading volume. A trader generating high turnover — regardless of profitability — can earn substantial fee income from followers. The Sharpe Ratio does not capture this dynamic, but it does serve as a check against the worst manifestation of it: a trader churning positions for fee generation will exhibit elevated volatility relative to returns, which the ratio will penalize.
For those building broader analytical context around crypto market dynamics and trader behavior, resources covering global cryptocurrency and blockchain developments can provide macro-level signals that inform whether a Master Trader's edge is structural or transient.
The bottom line for copiers: Bybit's leaderboard is designed to surface attention, not quality. The Sharpe Ratio is the closest thing to a quality signal the platform offers. Use the 90-day window, filter above 1.0, cross-reference against drawdown and win rate, and understand that even a strong ratio reflects the past in a market regime that may not persist into next week. No metric replaces the discipline of position sizing your copy allocation as if the Master Trader's worst drawdown is not behind them — because it almost certainly is not.